My Blog
Project Part 1
Preparing the Gender Gap in Median Earnings Data for Plotting
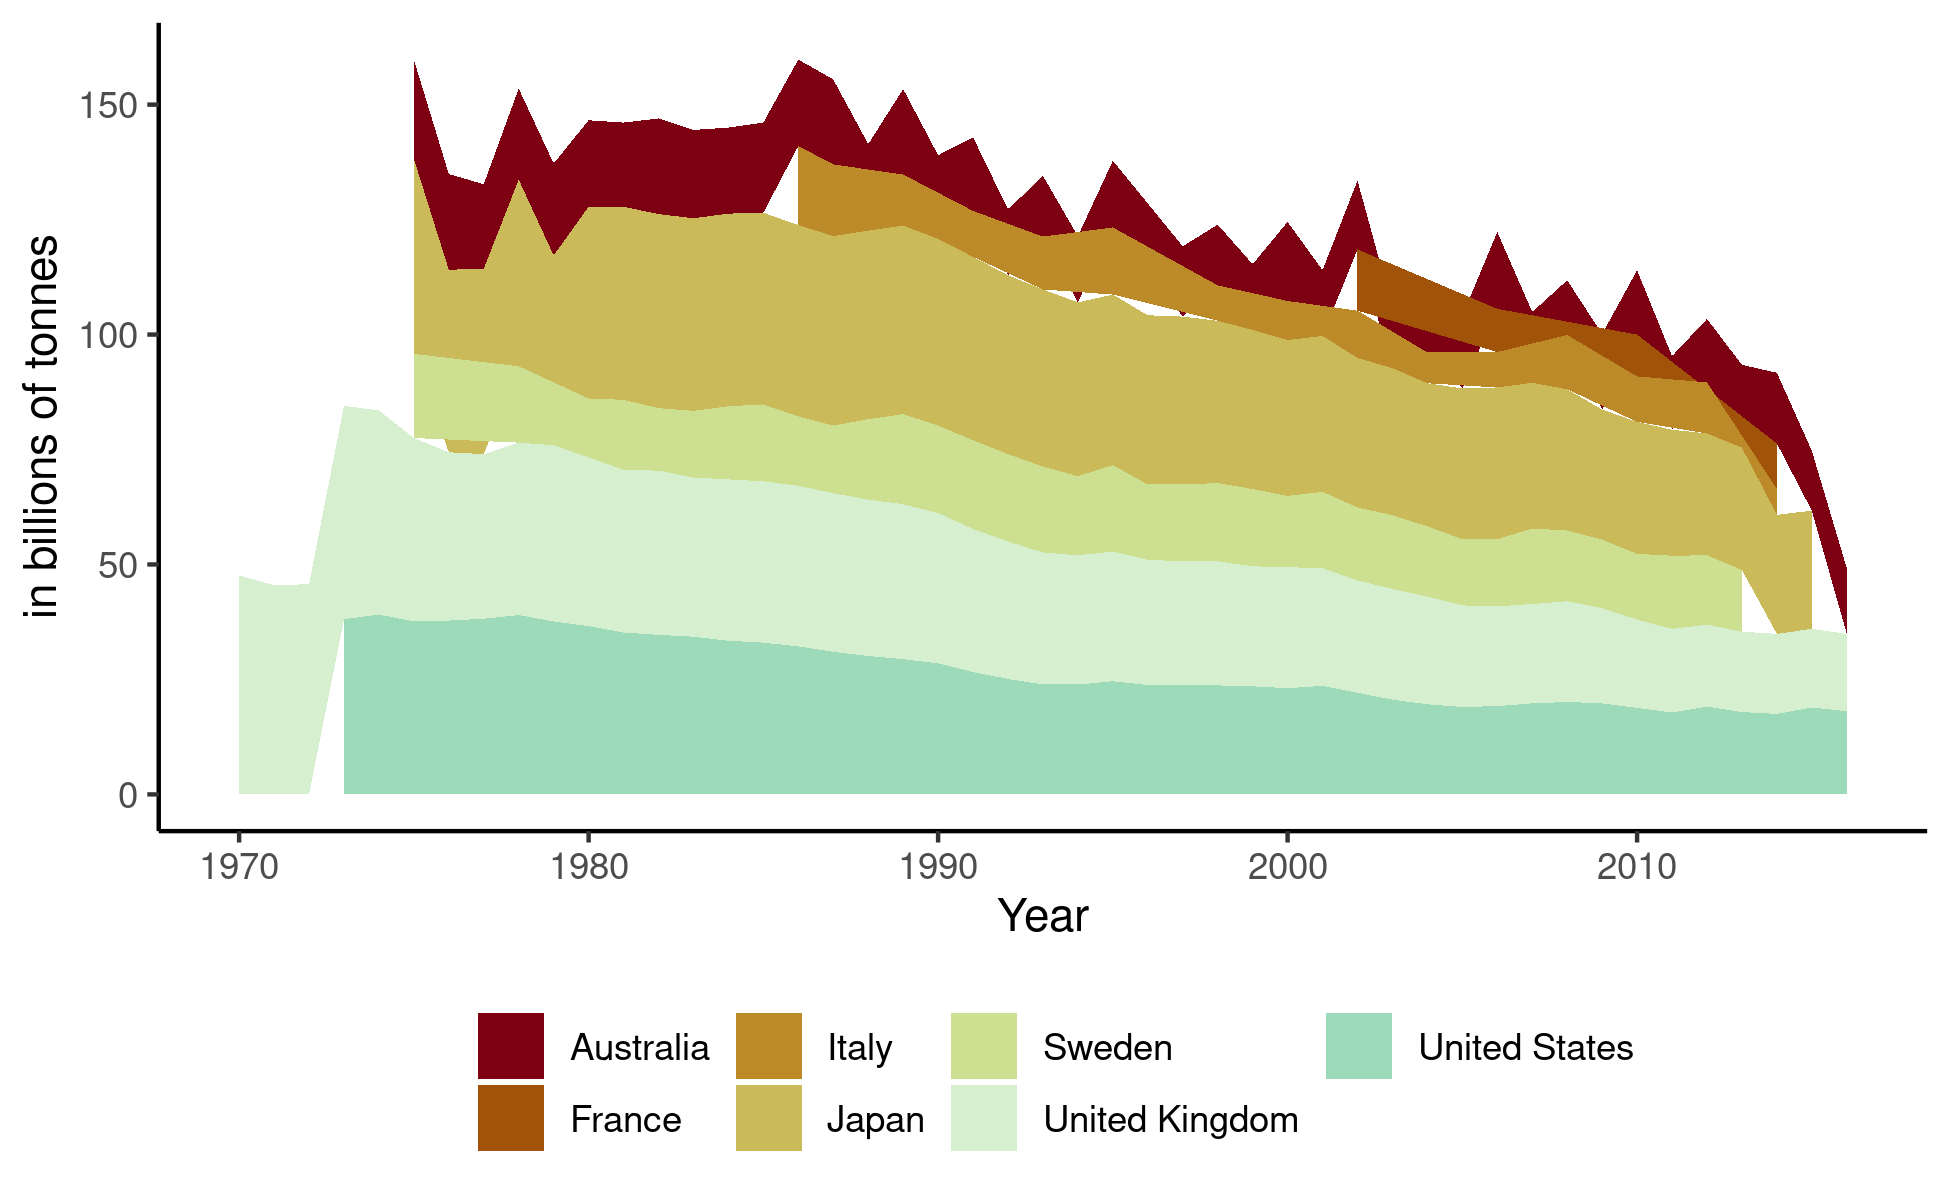
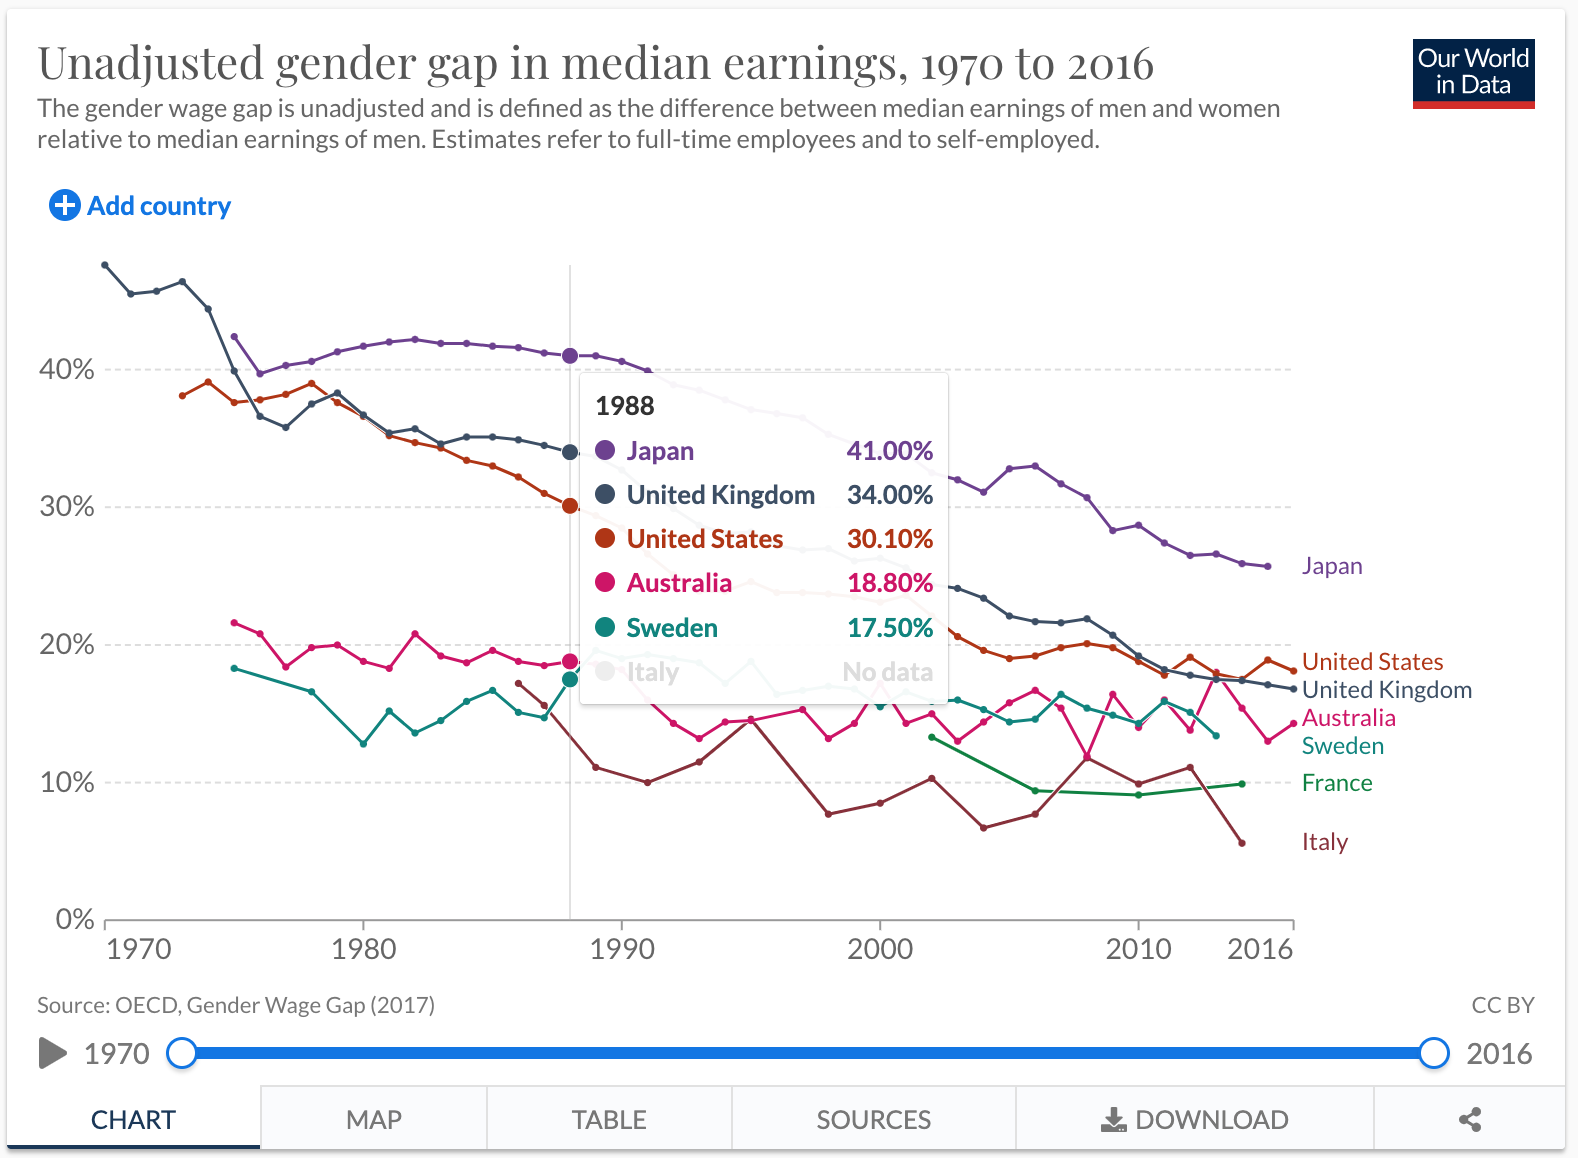
Project Part 2
Interactive and static plots of Wage Gaps from 1970 to 2016
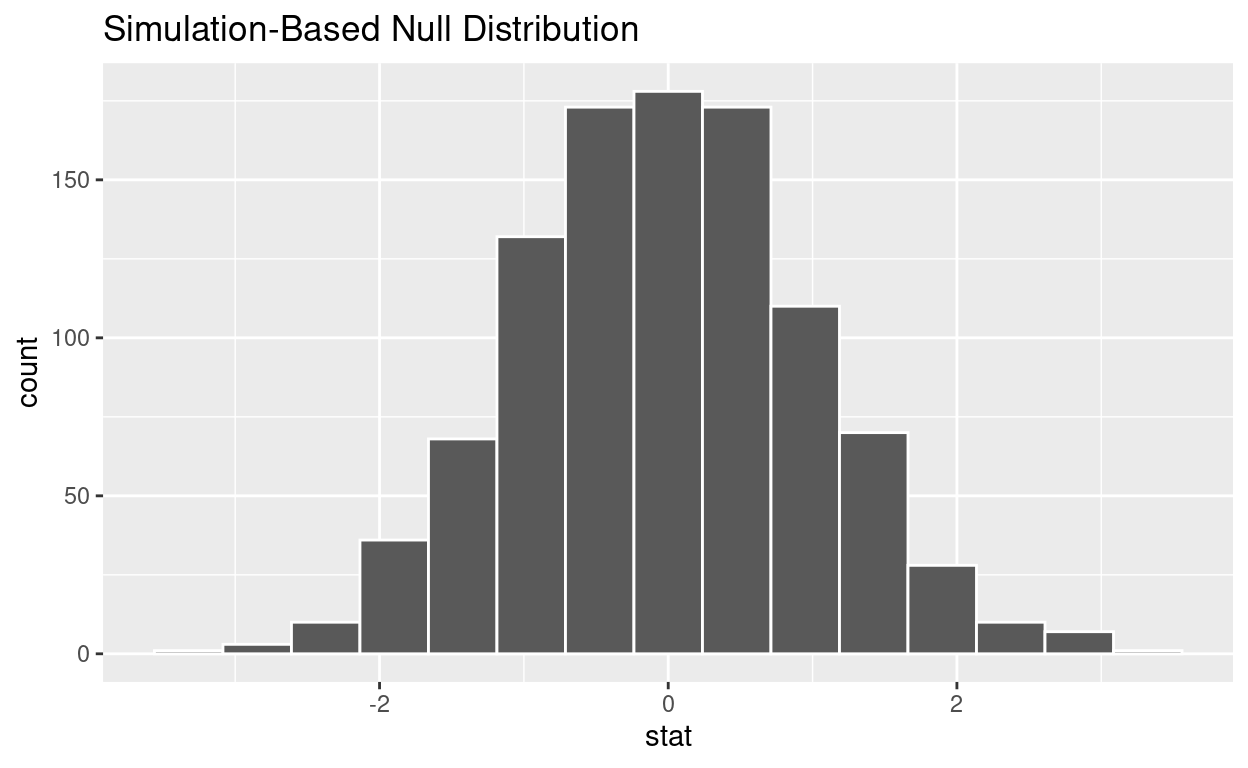
Hypothesis Testing
using computer simulation. Based on examples from the `infer` package. Code for Quiz 13.
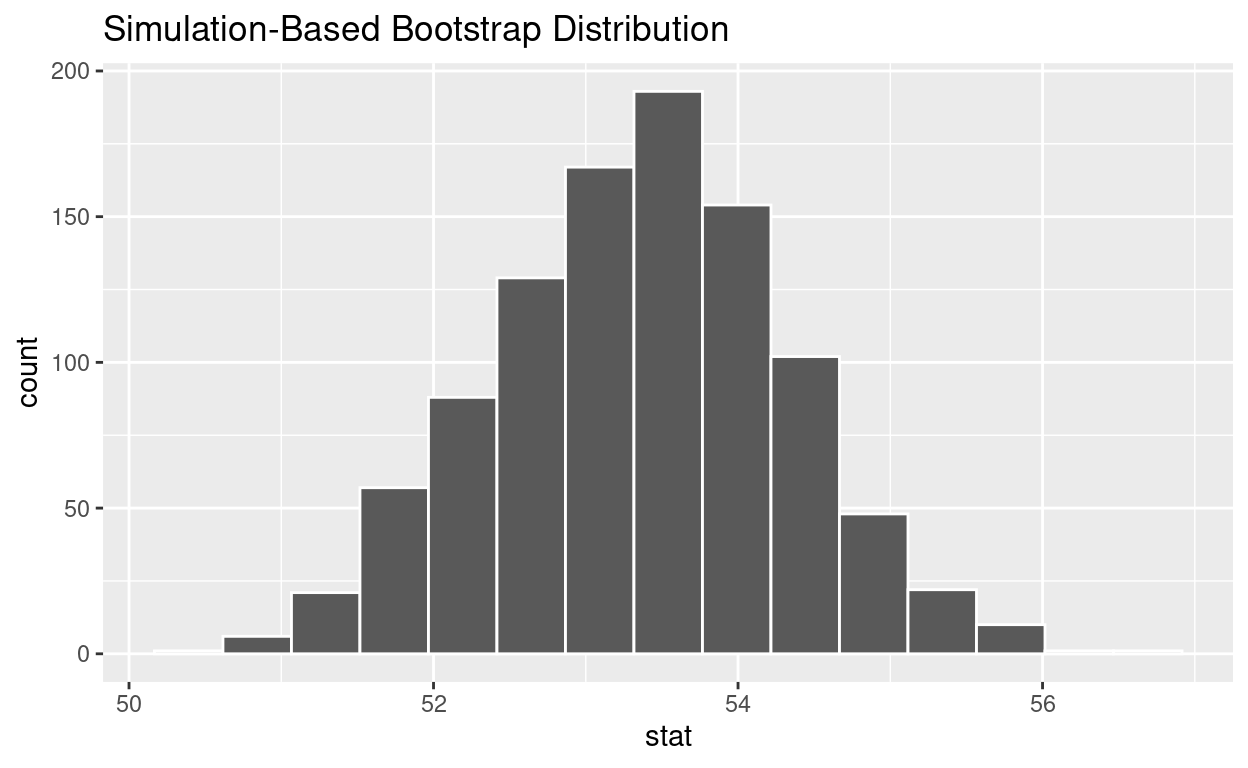
Bootstrapping
Based on Chapter 8 of ModernDive. Code for Quiz 12.
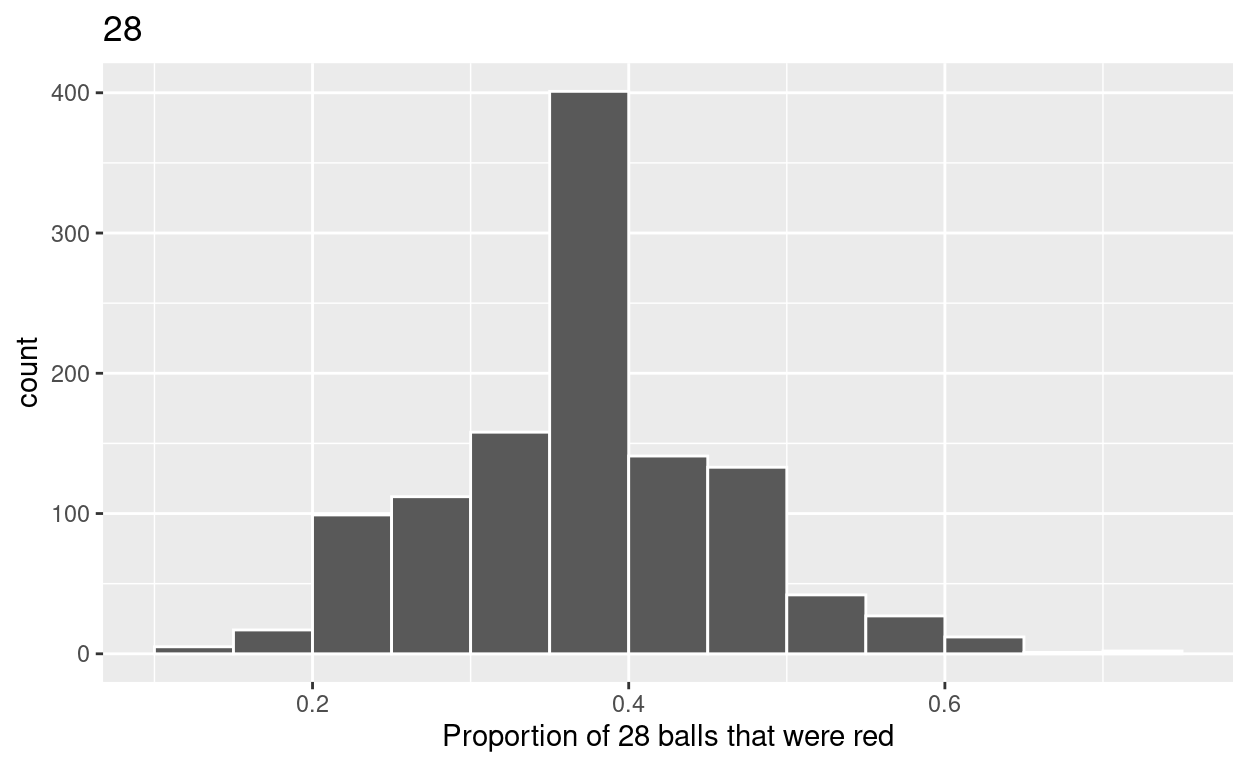
Sampling
Based on Chapter 7 of ModernDive. Code for Quiz 11.
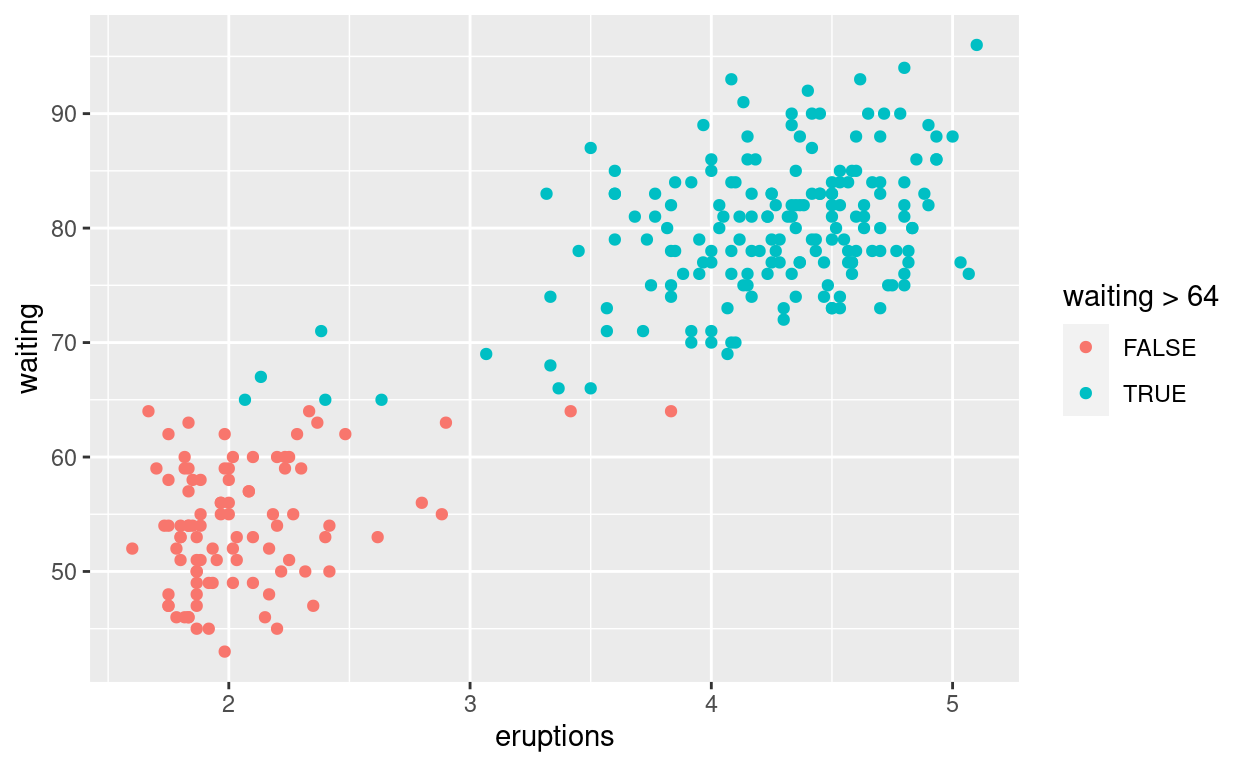
Data Visualization
Code for Quiz 9.
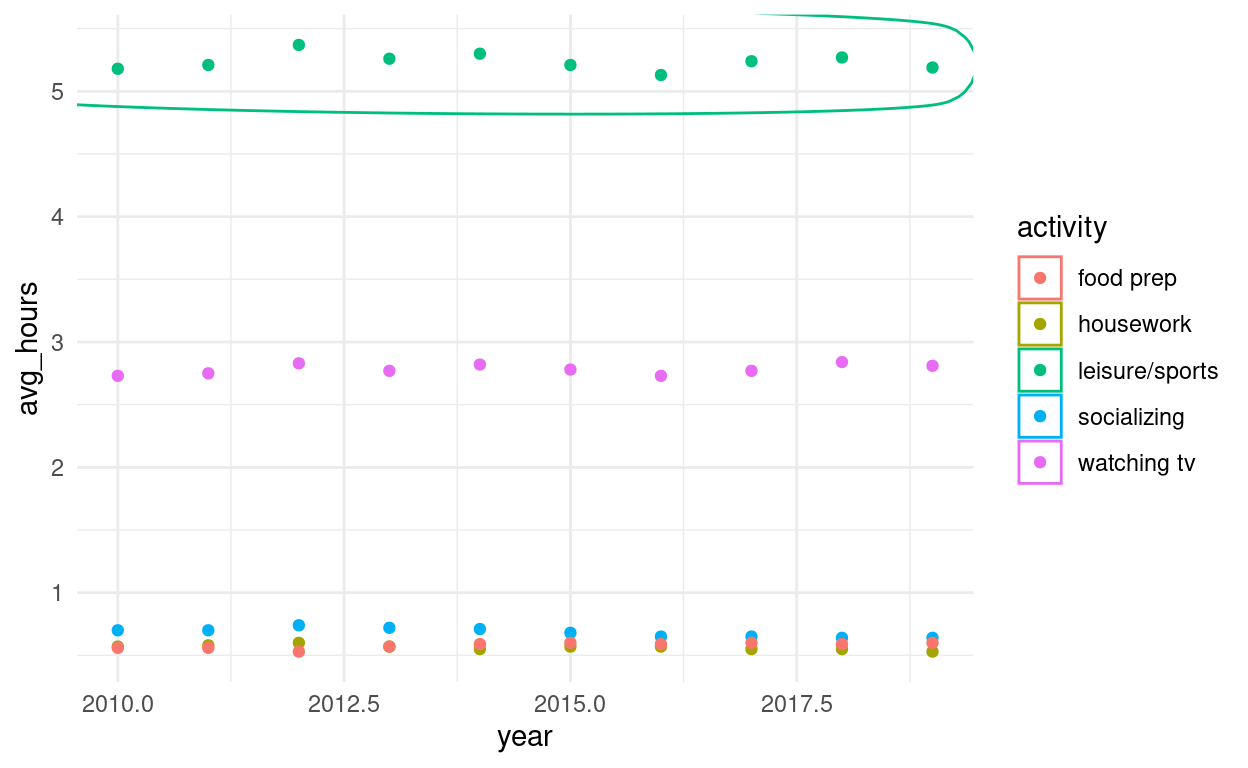
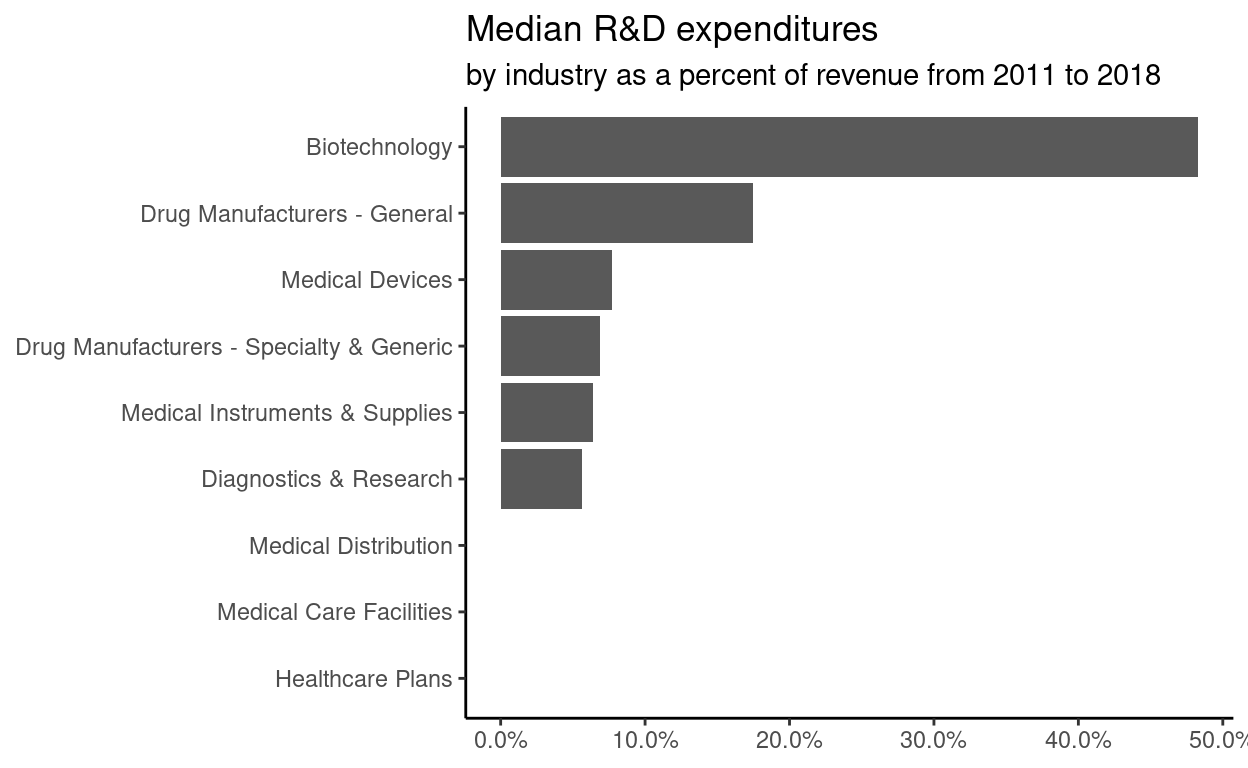
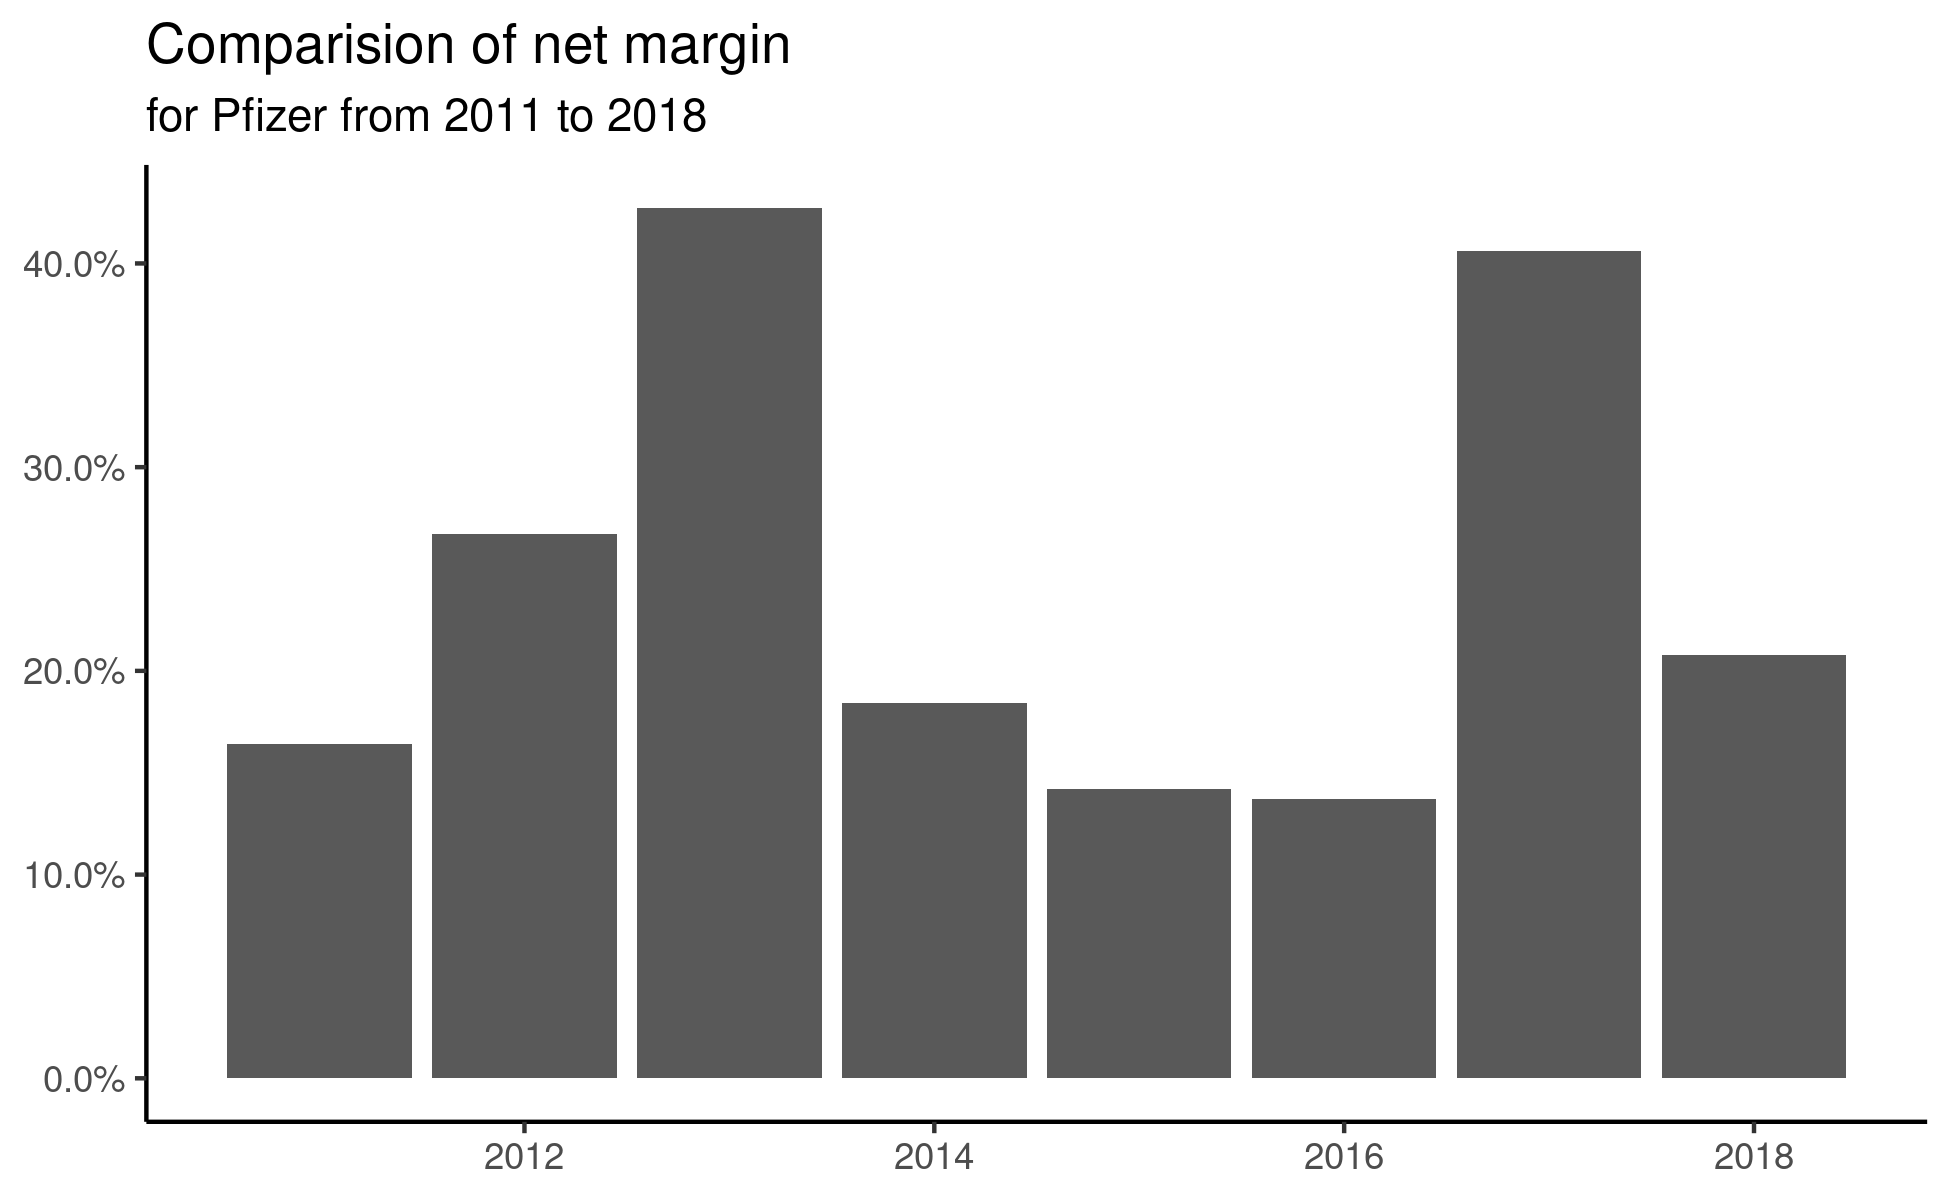
Exploratory analysis II
Data visualization, part 2. Code for Quiz 8.
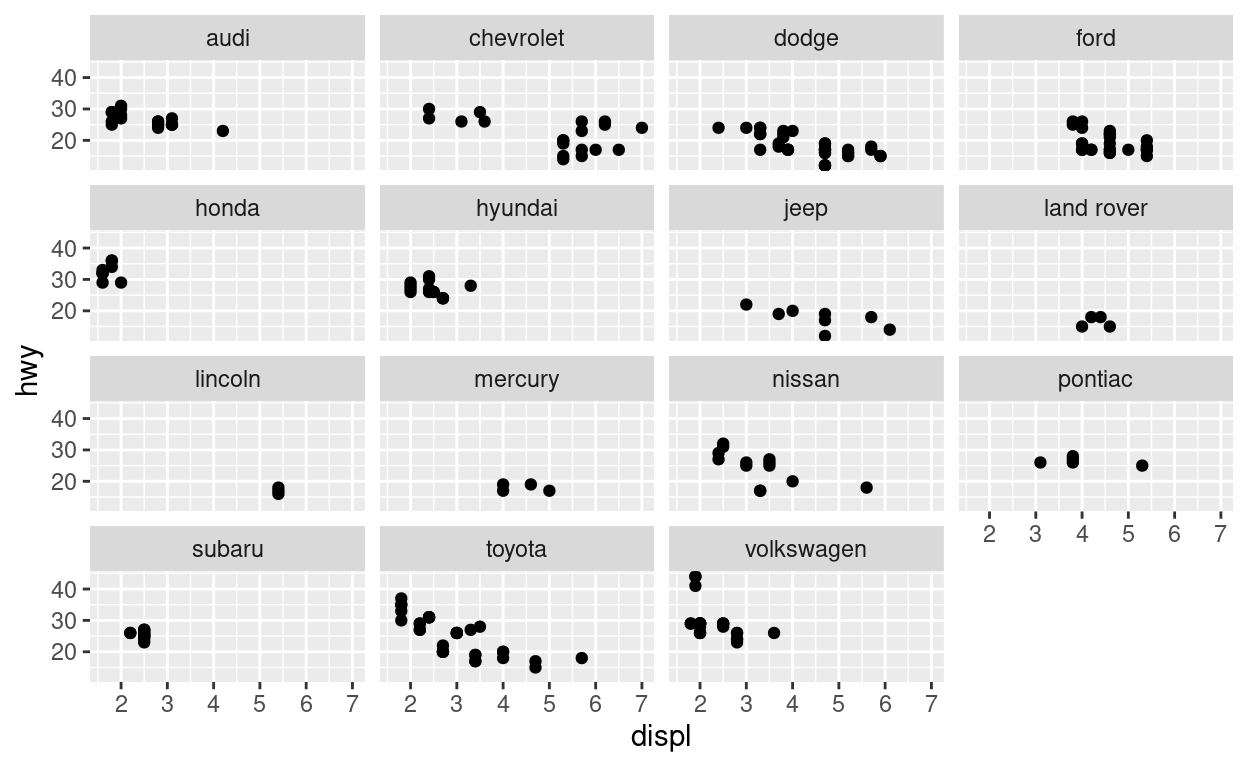
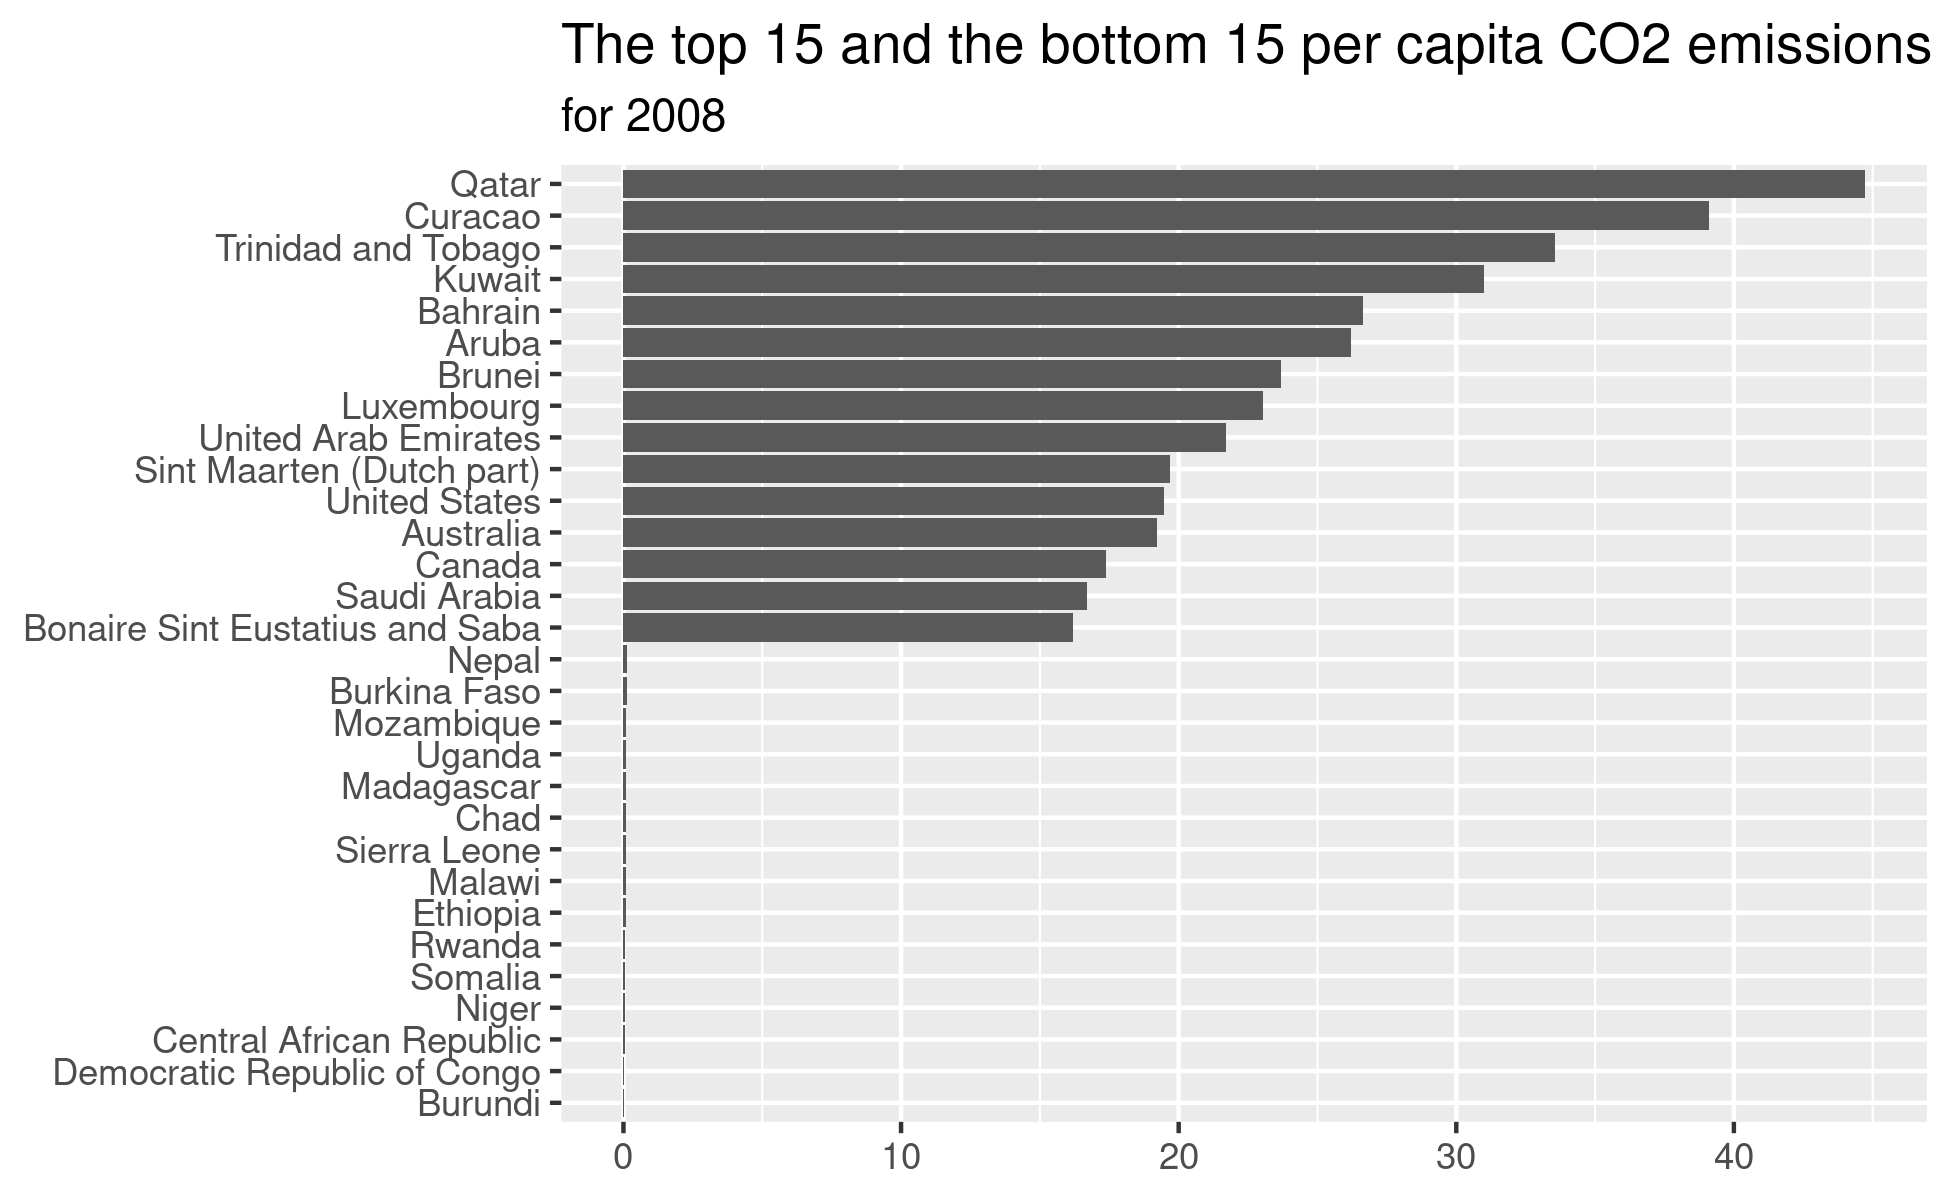
Exploratory analysis
Data visualization, part 1. Code for Quiz 7.
Joining Data
Code for Quiz 6, more dplyr and our first interactive chart using echarts4r.
Data Manipulation
Code for quiz 5. More practice with dplyr functions.
Reading and writing data
Practice reading and writing data, more dplyr and a plot.
Introduction to dplyr
Code and text for Quiz 3.
Summary Statistics
Comparison of R and Excel